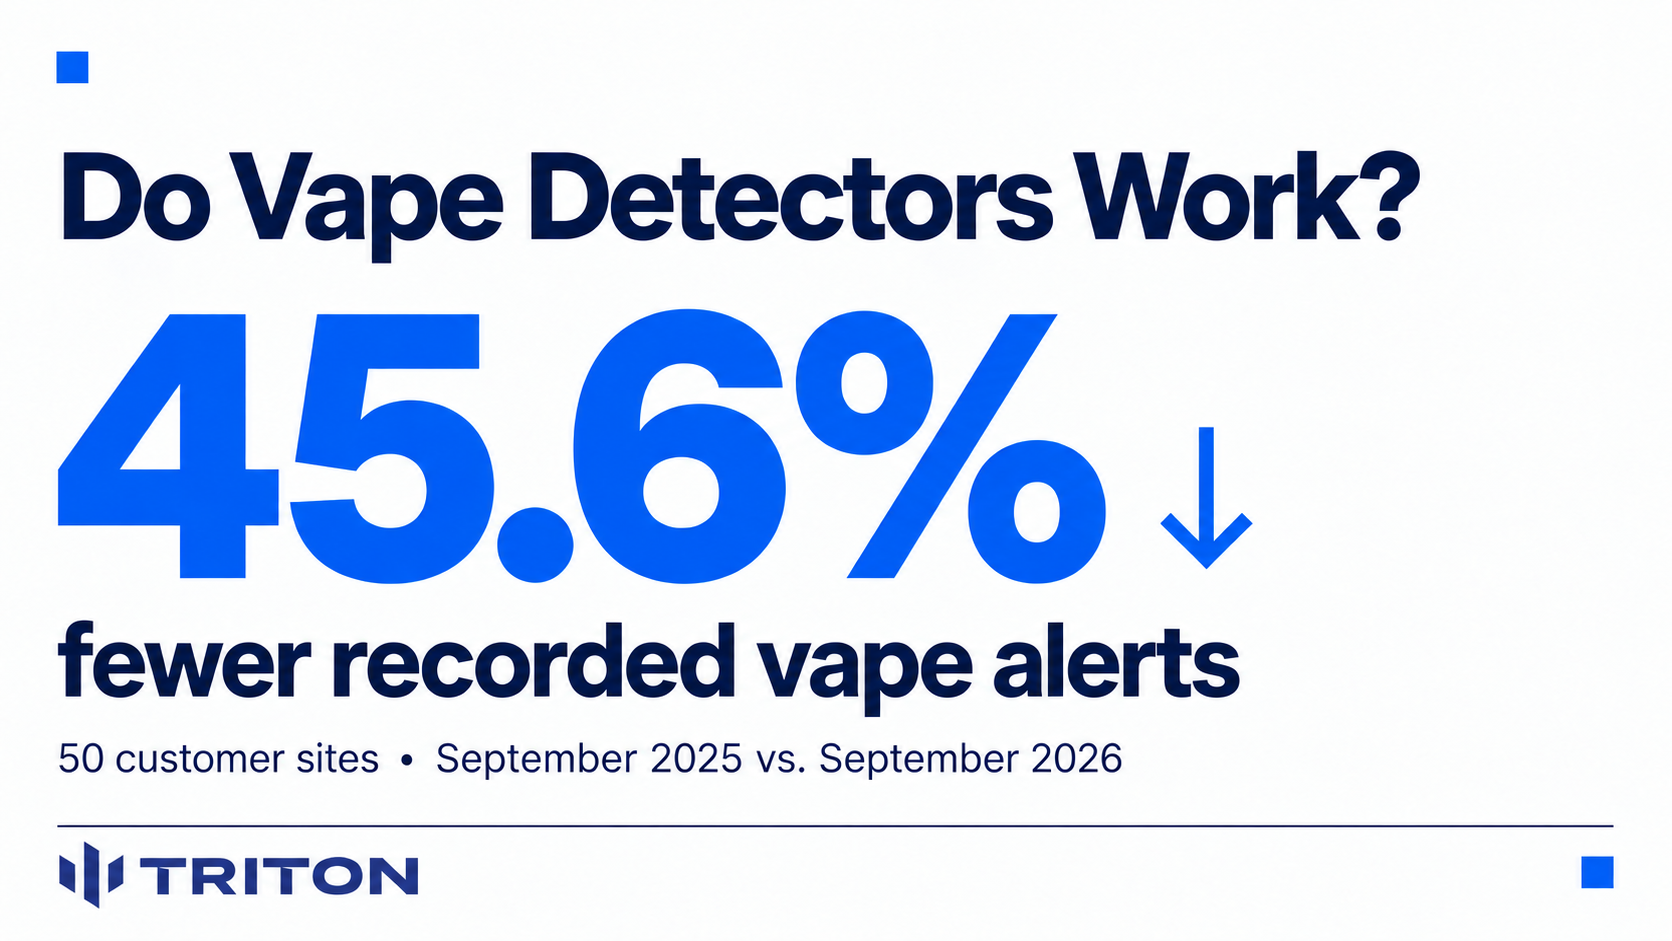
Short answer: Yes, Triton's customer data and polling show that vape detectors can help schools address vaping when paired with staff response and follow-up. Across 50 sites selected from a randomized customer list, recorded vape alerts fell 45.6% year over year, from 14,218 in September 2025 to 7,736 in September 2026. Alerts declined at 45 of 50 sites (90%). Staff at schools with large declines described improvements that matched the data and credited fast response, consistent follow-up, and education alongside the sensors.
Key findings
Across 50 schools and districts using Triton sensors, recorded vape alerts fell 45.6% from September 2025 to September 2026: from 14,218 alerts to 7,736. We wanted to test that quantitative finding against qualitative evidence from the people working in those buildings. After analyzing the de-identified Triton Cloud data, we asked school staff two questions: did the decline match what they observed, and what did they think contributed to it? Their responses help explain how schools achieved the improvements reflected in the alert counts.
The headline numbers:
- 45.6% pooled decline in vape alerts across all 50 sites (14,218 → 7,736).
- 57.2% median decline at the individual-site level.
- 45 of 50 sites (90%) recorded fewer alerts in September 2026 than in September 2025.
- 32 of 50 sites (64%) cut alerts by half or more.
- 5 of 50 sites (10%) recorded more alerts.
Do vape detectors work? Yes, Triton customers in this 50-site sample recorded 45.6% fewer vape alerts year over year, with declines at 90% of sites. Staff feedback supports the use of detectors as part of a broader effort to reduce vaping through prompt response, consistent follow-up, and education. The 45.6% figure measures recorded alerts; it does not establish an equivalent reduction in all vaping or isolate the effect of the sensors alone.
Why we ran this analysis
Triton Sensors are used by more than 3,000 customers. That gives us a large body of real-world detection data, and we wanted to use it to answer a question schools ask us constantly: do vape detectors work?
There is a lot of misinformation online about this. Detecting vaping reliably and demonstrating a sustained reduction in vaping are different questions, and published research does not always measure the same outcomes. We wanted the most accurate report we could produce, built on two kinds of evidence: measured alert data from a broad set of schools, and feedback from the staff who use the sensors every day. For this initial report, we analyzed de-identified Triton Cloud customer data in aggregate across 50 sites, then paired the results with feedback from school staff.
A 2026 Australian study used indoor air-quality monitors, rather than purpose-built vape detectors, across 37 restroom and changing-room locations. The system generated alerts when particulate readings crossed configured thresholds. An environmental smoke event produced false positives, and staff responsiveness declined over time as alert fatigue and competing priorities took hold. This highlights why accuracy, false positive rejection and staff response must work together: staff need alerts they can trust, clear responsibility for responding, and enough time to investigate. A sensor cannot support timely intervention if its alerts are ignored.
A Canadian study published in 2026 gathered student and staff perceptions across five high schools in a single district in northwestern Ontario. Only one school had detectors operating during data collection; another installed them afterward, and three had none. Participants described potential benefits such as identifying students who vape and improving restroom access, alongside concerns about evasion and vaping moving elsewhere. These findings came from interviews and surveys about experiences and expectations, not measured changes in vaping or sensor-alert data. They provide insight into attitudes toward detectors, but do not establish how much vaping increased or decreased.
Earlier Triton customer case studies, including Match Charter Schools, examine the first several months of deployment, showing when declines begin rather than comparing the same month a year apart. At Match, the sharp decline appeared between late September and early October, and weekly vaping events fell from a mid-September peak of 47 to single digits by mid-November. This illustrates how declines can emerge within the first several weeks as students become aware of the sensors and staff act on alerts; the timing varies by school. The 50-site analysis below asks a different question: whether lower alert counts persist year over year across a broader set of customer sites.
How we chose the sites
We entered every customer site into an online randomizer, then screened the shuffled list for enough history to compare September 2025 with September 2026. The resulting sample includes 50 sites. Sites that came online too recently could not be included.
Why September
September is the first full month with students in the building for most schools. Many schools install sensors over the summer, making September a useful early benchmark as students return and become aware of the devices. Comparing the same month a year later gives schools time to refine their policies and response procedures, and students time to understand that vaping will prompt a response. It also reduces seasonal differences between measurements. Installation dates and school calendars vary; both comparison periods reflect schools already using Triton.
What this sample is, and what comes next
These 50 sites are a poll of a much larger customer base. Like an election poll, it uses a random subset to estimate a broader pattern, and we expect it to be a meaningful indicator of what the full dataset will show. We are giving independent researchers access to our complete dataset, and a full report is in progress. Below, we separate the measured alert trends from staff observations so readers can see what each contributes.
What the data shows
Across the 50 customer sites, recorded vape alerts fell by 6,482, from 14,218 in September 2025 to 7,736 in September 2026. That is a 45.6% aggregate decline. The table below summarizes both the combined results and how widely declines were distributed across sites.
Summary: 50 sites, 14,218 → 7,736 vape alerts, September 2025 vs. September 2026, Triton Cloud data.
The two sites with the most September 2025 alerts accounted for 4,778 of 14,218 baseline alerts, or 33.6% of the total. Their declines of 18.1% and 27.9% therefore carry substantial weight in the pooled result. Both remain in the headline analysis. For context, the other 48 sites had a combined decline of 57.1%; the 28 sites with at least 100 baseline alerts had a combined decline of 45.2%.
Pooled vs. median. The pooled decline of 45.6% compares the total number of alerts across all 50 sites, giving higher-volume sites more weight. The median decline of 57.2% is the midpoint of the 50 individual percentage changes. The mean site decline of 50.2% is the arithmetic average of those changes. Small baseline counts can produce large percentage swings: an increase from 16 to 28 alerts is a 75.0% increase, but represents 12 additional alerts.
Site-by-site counts for all 50 sites are included in the full dataset at the end of this article.
Who is in the sample
The sample includes 50 customer sites across public, public charter, and private schools, with locations in four U.S. regions, Canada, and the United Kingdom. A site is a customer account and may represent one school or a district with multiple schools; this is not a sample of exactly 50 individual school buildings.
Demographic information and approximate enrollment bands are available for all 50 sites. U.S. regions follow Census Bureau definitions; Canadian and UK sites are listed by country. The public/state-funded category includes the UK's voluntary-aided school. Enrollment bands use available school records and may predate the comparison period.
What school staff told us
Aggregate data shows how recorded alert counts changed.
Customer feedback adds context about what staff did after an alert and whether the trend matched their experience. We asked administrators whether the decline matched what they saw, what worked, and what else changed. The accounts below come from schools with declines and illustrate their experiences; they are not a survey of all 50 sites.
Fremont Middle School: catching it earlier
Fremont recorded 69 vape alerts in September 2025 and 6 in September 2026, a 91.3% decline.
"I firmly believe that your product has helped us significantly in our district with identifying kids at a younger age and working with their families to get help if/when needed." — Jeff Manka, former Principal, Fremont Middle School (Fremont, Nebraska)
Jeff Manka served as principal during much of the period covered by this analysis and has since moved to another school in the district. Fremont's new principal, Todd Niehaus, described a layered approach:
- "Vape detectors: These serve as a deterrent for students who are concerned about getting caught."
- "Prompt response: All members of the FMS office team prioritize getting to the restroom as quickly as possible when a vape detector activates."
- "Camera monitoring: Our office team diligently reviews camera footage to help identify students involved in suspected vaping incidents."
- "Consistent consequences: We consistently enforce consequences for vaping to reinforce clear expectations and accountability."
- "Drug education: Students caught using THC vapes receive drug education to help them understand the risks and make better decisions."
"We believe this combination of prevention, supervision, quick response, accountability, and education supports a safer school environment." — Todd Niehaus, Principal, Fremont Middle School
Fremont also assigns staff to supervise restrooms during passing periods and uses an electronic hall pass system to monitor restroom traffic.
James Island Charter High School: audible alerts and staff follow-up
James Island recorded 239 vape alerts in September 2025 and 102 in September 2026, a 57.3% decline.
"First, we turned on the siren function so that an audible alarm sounds each time vaping is detected. This has worked extremely well for us. Students who do not vape have even told us they feel more comfortable using the restrooms because everyone now knows that if someone vapes, the sensor will alert staff. Along those same lines, if we are unable to get a staff member to the restroom quickly after an alert, we review the cameras to determine which students were in the area and follow up with them as appropriate."
"Second, we close certain restrooms during peak times, particularly during lunch when students have more freedom to move throughout the building. This directs students to restrooms that we are able to monitor more effectively. As a result, we have seen some vaping shift to other areas, including hallways and classrooms, so we will continue looking for ways to combat the issue."
"Overall, the sensors have been a huge addition to our efforts to provide a safe environment for our students, and we have been very pleased with their effectiveness." — Brad Wilson, Campus Security Manager, James Island Charter High School (Charleston, SC)
James Island's experience connects a 57.3% decline in recorded vape alerts with practical changes in response and supervision. Brad's account also identifies displacement: some vaping shifted to hallways and classrooms. That makes the reduction in restroom alerts useful evidence, while underscoring why schools should also track activity elsewhere.
What schools with large declines did
Across our conversations with school staff, several common themes emerged about what made their deployments successful. Staff described how they acted on alerts, communicated expectations to students, and coordinated supervision. These are the practices and recommendations they emphasized:
- Proactive, fast response. Staff went to the restroom when an alert fired, not at the end of the period.
- Consistent enforcement and clear expectations. Schools made the consequences of vaping clear to students and followed through consistently, so students understood that an alert would lead to a response.
- Camera integration. Staff checked hallway footage outside the restroom at the alert timestamp to identify who entered and left. Triton ULTRA integrates with major video management systems (VMS), and Triton's Evidence Room automatically pairs each alert with the matching camera footage, so staff don't have to search recordings by hand.
- The sensor's built-in speaker. Some schools turned on Triton ULTRA's audible siren so students knew they had been detected.
- Restroom supervision and pass tracking. Schools paired alerts with hall monitors or digital hall passes, so they knew who was in the restroom at alert time.
- Wanding. Some schools paired camera review with handheld metal-detector wanding to help locate a vape device on a student.
- Education and family contact. Schools used detections as a reason to talk with students and families, not only to discipline. A cluster randomized trial published in The Lancet Public Health also found that a school-based vaping education program reduced adolescent e-cigarette use compared with usual health education, supporting the role of education alongside a school's detection and response efforts.
- Targeted restroom access. Some schools temporarily closed problem restrooms to concentrate supervision in fewer locations, especially those closer to staff. This made it easier to respond quickly and increased the chance of reaching students while vaping was occurring.
- Assign who responds. Name the specific staff member responsible for each restroom or time block, so every alert has a clear owner.
- Keep staff connected in real time. Route alerts into the channels staff already use, such as text, Google Chat, Microsoft Teams, or radio, so the assigned responder knows immediately and can call for backup.
Together, these accounts show how Triton ULTRA can give staff timely information to support intervention. The aggregate data records fewer alerts over time, while the anecdotes explain how individual schools combined detection with supervision, accountability, and education.
What this data does not show
We want this analysis to be useful, so we are clear about its limits.
- Alerts indicate suspected vaping. A sensor alert is a useful signal for staff to investigate, but it does not confirm a vaping incident or identify a student on its own. While Triton ULTRA’s vape detection is 98.9% accurate, there are occasional false alerts. Staff follow-up provides that confirmation; this analysis did not independently verify every alert.
- There is no control group. We did not compare these schools with similar schools that have no detectors. Part of the decline may reflect wider changes in youth vaping, new school policies, or staffing changes.
- Operational changes can affect alert counts. This analysis does not adjust for restroom closures, detectors being added or removed, devices being offline, or other changes in coverage and use. These factors could affect the number of recorded alerts independently of changes in vaping behavior.
- Some vaping moves. One administrator reported that some students shifted vaping from restrooms to hallways and classrooms. A drop in restroom alerts does not always mean an equal drop in vaping.
- This is an initial customer-data analysis, not a peer-reviewed study. Randomizing the customer list helps reduce deliberate selection of favorable results, but eligibility requirements and a 50-site sample limit how broadly the findings can be generalized. These results do not establish an expected reduction for every Triton customer or for other detector brands. Triton is working with independent researchers and providing access to a broader customer dataset for a fuller report.
- Not all vape detectors are created equal. This analysis was performed only on Triton Sensors customers, not schools with other branded vape detectors. Detector accuracy, response time, notification options, software usability, and more can vary greatly and affect a school’s ability to respond to alerts in a timely manner.
Frequently asked questions
Do vape detectors work in schools?
Yes, an analysis of 50 Triton customer sites drawn from a randomized customer list found a substantial year-over-year decline in recorded vaping activity: 45.6% fewer vape alerts in September 2026 than in September 2025, with declines at 45 of 50 sites. Staff accounts describe improvements that matched the data and explain how detectors supported response and intervention. These findings support their usefulness as part of a broader school response, but do not isolate the effect of detectors alone.
Why might a school not see results from vape detectors?
Detecting vaping and changing behavior are different tasks. Placement, sensor uptime, notification routing, and staff follow-up can affect a deployment's usefulness. Five sites in this sample recorded more alerts, and their reasons have not yet been established. Staff at schools with declines emphasized quick response, consistent consequences, and education.
How much did vape alerts decline in this analysis?
Recorded vape alerts fell 45.6% in aggregate across 50 Triton customer sites. The median site decline was 57.2%, and 32 of 50 sites (64%) had declines of at least 50%. These percentages measure changes in recorded alerts, not a verified reduction in the number of students vaping or total vaping incidents.
How were the sites in this analysis chosen?
We entered all Triton customer sites into an online randomizer, then screened the shuffled list for sites with enough data to compare September 2025 with September 2026. Sites that came online too recently were ineligible.
What should schools do alongside vape detectors?
Respond to every alert promptly, track restroom passes, review hallway cameras at alert time, apply consistent consequences, and involve families early.
Methodology
- Data source: Vape-alert counts from Triton Cloud Report Generation for each customer account.
- Comparison: Total vape alerts for September 1–30, 2025 and September 1–30, 2026. Both periods reflect use of Triton sensors; this is a year-over-year comparison, not a before-and-after installation study. Counts are monthly totals rather than rates adjusted for enrollment, active sensors, or instructional days.
- Calculation: Decline = (2025 total − 2026 total) ÷ 2025 total × 100. Pooled decline uses summed totals across all sites. One district account (Site 05) covers four schools and is counted as one site.
- Site selection: We entered the customer-site list into an online randomizer, then screened sites for sufficient history to compare both September periods. Sites that had come online too recently were ineligible. The final analysis includes 50 sites; the screening did not constitute a full adjustment for uptime or changes in sensor coverage.
- Anonymization: Sites are numbered by September 2025 alert volume. Schools are named only where staff gave written permission. The dataset lists school type, level, region or country, and approximate enrollment. Exact locations of anonymized sites are withheld.
- Analysis date: October 2026.