Triton ULTRA Vape Detection Accuracy Report
The evidence behind our 98.9% accuracy claim: Triton ULTRA correctly classified 8,315 of 8,400 logged test events across 30 products and sources.
Key findings
Triton ULTRA correctly classified 8,315 of 8,400 logged test events, producing an observed aggregate accuracy of 98.988%. Triton reports this conservatively as 98.9%, rounding down to one decimal place. This figure describes the study corpus; performance can vary with the product, distance, airflow, room geometry, and installation.
| Validation corpus | 8,400 logged test events |
|---|---|
| Test coverage | 2,900 genuine vape events + 5,500 non-vape events; 30 distinct sources |
| Observed aggregate accuracy | 98.988% (8,315 / 8,400) |
| Published accuracy figure | 98.9%, reported conservatively by rounding down to one decimal place |
| Firmware Version | Triton ULTRA May 25th 2026 Update |
The testing program evaluated genuine vape events alongside non-vape aerosols, vapors, and fumes that can challenge sensor classification. It included 23 non-vape sources and 7 vape-event sources representing different products and test conditions.
How the accuracy figure was calculated
| Outcome | Events | Meaning |
|---|---|---|
| True positive | 2,861 | Genuine vape event correctly detected |
| True negative | 5,454 | Non-vape event correctly rejected |
| False positive | 46 | Non-vape event incorrectly classified as vape |
| False negative | 39 | Genuine vape event not classified as vape |
| Total | 8,400 | All logged events |
Accuracy = (True positives + True negatives) / Total events
(2,861 + 5,454) / 8,400 = 98.988% observed accuracy.
Published accuracy: 98.9%, reported conservatively by rounding down.
Aggregate accuracy incorporates both sides of the classification task: detecting genuine vape events and correctly rejecting the non-vape sources included in the test set.
Study design and test coverage
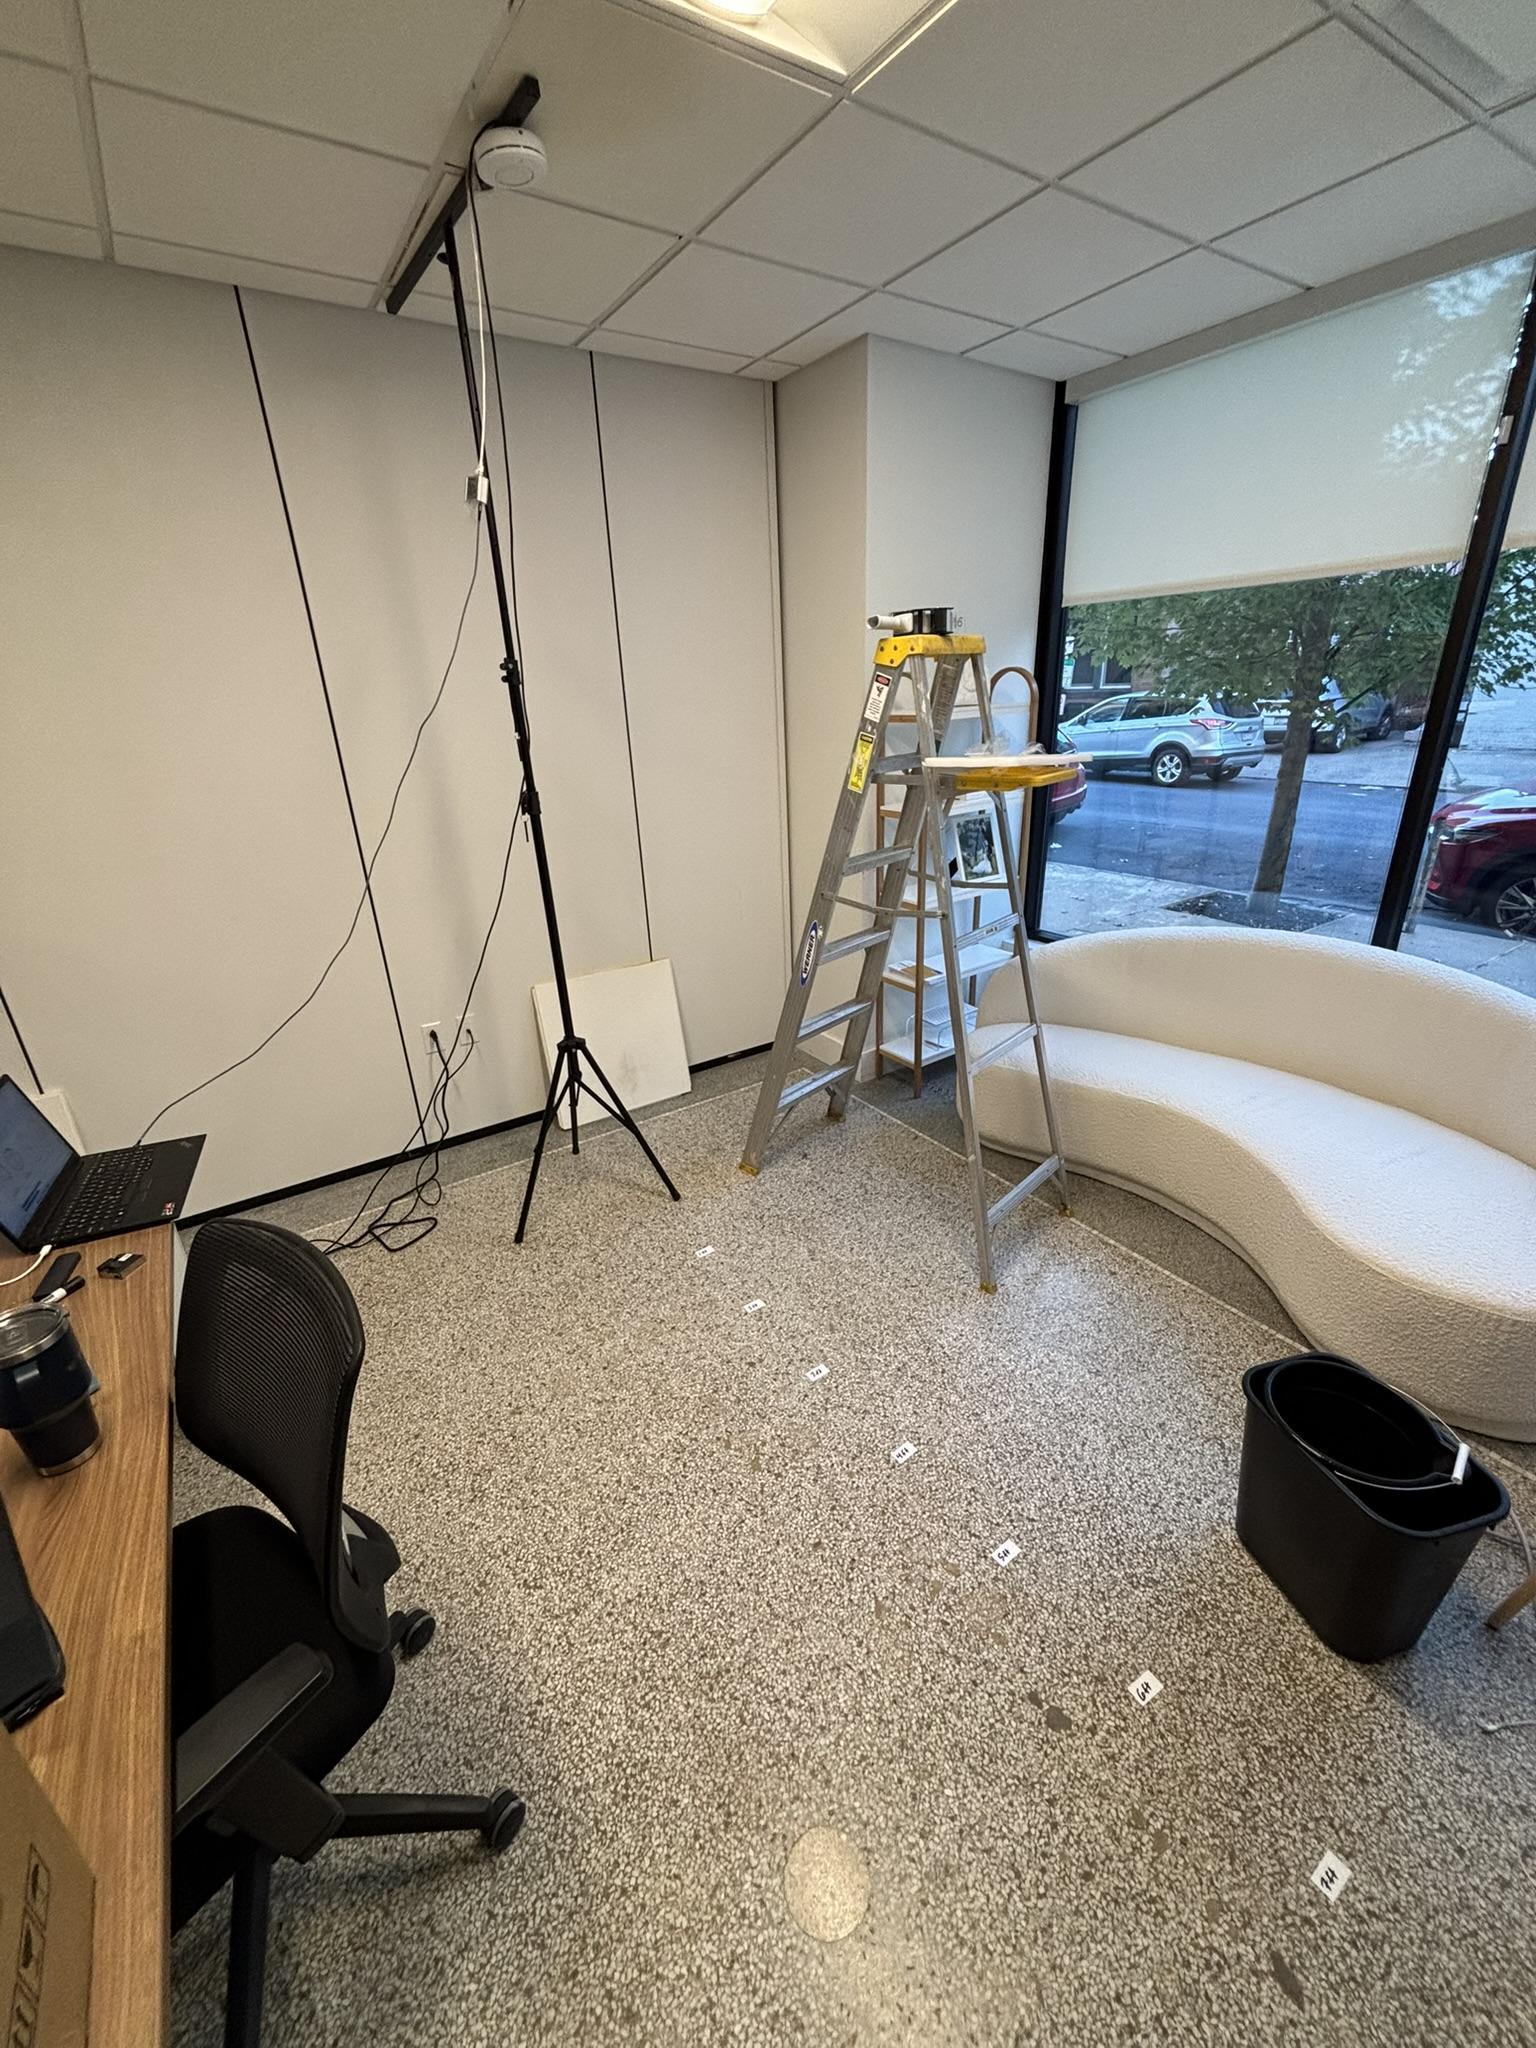
Testing took place at intervals from May to July 2026 in actual school restrooms, a commercial environment, and a residential environment. Triton ULTRA used default sensitivity settings and the firmware released on May 25, 2026.
Each event has a unique Testing ID and a Source ID linking it to the product and source category in the workbook’s Summary sheet. The log records the expected result, sensor output, binary assessment, test distance, and amount used.
| Dataset component | Events | Share |
|---|---|---|
| Genuine vape events | 2,900 | 34.52% |
| Non-vape events | 5,500 | 65.48% |
| Total | 8,400 | 100.00% |
Non-vape sources included aerosol body sprays, antiperspirants, hairsprays, dry shampoo, disinfectants, fabric and air refreshers, surface cleaners, thermal styling, water vapor, and soldering fumes. Vape sources included disposable and refillable nicotine devices, high-VG and high-PG e-liquids, zero-nicotine e-liquid, a Delta-8 cartridge device, and exhalation into clothing.

Test methodology
Event-level scoring
Each trial used a two-minute observation window, beginning with the first puff, spray, or other introduction of the source. A vape alert within that window counted as a true positive for a genuine vape trial and a false positive for a non-vape trial. No alert counted as a false negative for a vape trial and a true negative for a non-vape trial.
Ventilation between trials
Rooms were ventilated between trials until residual material had dissipated and a sufficiently clean-air baseline returned: PM2.5 below 10 µg/m³ and TVOC below 400 ppb. This procedure was intended to minimize carryover between events.
The two-minute window is the classification-scoring criterion. It is not a typical detection time or a measurement of notification delivery speed.
Distances and quantities
Source-to-sensor distances ranged from 0 to 6 feet, with a median of 3 feet. Amounts ranged from 1 to 60 units, depending on the source. The log includes 4,200 spray-based events, 2,900 puff-based vape events, 800 events measured in seconds, and 500 events measured in squirts.

Complete results
The tables below reproduce the report’s results. On smaller screens, scroll within a table to see every column.
Overall classification performance
| Metric | Result | Calculation | Interpretation |
|---|---|---|---|
| Overall accuracy | 98.988% | 8,315 / 8,400 | 98.9% reported conservatively |
| Vape-event sensitivity | 98.655% | 2,861 / 2,900 | Share of genuine vape events detected |
| Non-vape specificity | 99.164% | 5,454 / 5,500 | Share of non-vape events correctly rejected |
| False-positive rate | 0.836% | 46 / 5,500 | Non-vape events incorrectly alerted |
| False-negative rate | 1.345% | 39 / 2,900 | Genuine vape events missed |
Results by source category
| Type | Source category | Events | Correct | Errors | Accuracy |
|---|---|---|---|---|---|
| Non-vape | Aerosol antiperspirant | 2,000 | 1,980 | 20 | 99.00% |
| Non-vape | Aerosol body spray | 1,600 | 1,591 | 9 | 99.44% |
| Non-vape | Combustion / fume | 300 | 291 | 9 | 97.00% |
| Non-vape | Disinfectant spray | 100 | 100 | 0 | 100.00% |
| Non-vape | Dry shampoo | 100 | 96 | 4 | 96.00% |
| Non-vape | Fabric / air refresher | 200 | 200 | 0 | 100.00% |
| Non-vape | Hairspray | 300 | 298 | 2 | 99.33% |
| Non-vape | Surface cleaner | 400 | 400 | 0 | 100.00% |
| Non-vape | Thermal styling | 400 | 398 | 2 | 99.50% |
| Non-vape | Water vapor | 100 | 100 | 0 | 100.00% |
| Vape | Filtered vape | 400 | 393 | 7 | 98.25% |
| Vape | Nicotine vape | 1,800 | 1,780 | 20 | 98.89% |
| Vape | Nicotine-free vape | 200 | 197 | 3 | 98.50% |
| Vape | THC vape | 500 | 491 | 9 | 98.20% |
Results by individual product / source
| ID | Type | Category | Product / source | Events | Errors | Accuracy |
|---|---|---|---|---|---|---|
| P01 | Non-vape | Aerosol body spray | Dove pomegranate spray | 400 | 2 | 99.50% |
| P02 | Non-vape | Aerosol body spray | AXE Collision body spray | 400 | 0 | 100.00% |
| P03 | Non-vape | Aerosol body spray | Dove Men+Care whole-body spray | 400 | 4 | 99.00% |
| P04 | Non-vape | Aerosol body spray | Dove coconut/vanilla whole-body spray | 400 | 3 | 99.25% |
| P05 | Non-vape | Aerosol antiperspirant | Degree Ultraclear Fresh | 400 | 4 | 99.00% |
| P06 | Non-vape | Aerosol antiperspirant | Degree rose/waterlily deodorant | 400 | 7 | 98.25% |
| P07 | Non-vape | Aerosol antiperspirant | Dove Cool Essentials | 400 | 6 | 98.50% |
| P08 | Non-vape | Aerosol antiperspirant | Dove Rose Petals | 400 | 3 | 99.25% |
| P09 | Non-vape | Aerosol antiperspirant | Native sea salt/cedar deodorant | 400 | 0 | 100.00% |
| P10 | Non-vape | Hairspray | TRESemme Silk Smooth hairspray | 100 | 2 | 98.00% |
| P11 | Non-vape | Hairspray | Pantene strong-hold hairspray | 100 | 0 | 100.00% |
| P12 | Non-vape | Hairspray | Kendra Volume hairspray | 100 | 0 | 100.00% |
| P13 | Non-vape | Dry shampoo | Batiste dry shampoo | 100 | 4 | 96.00% |
| P14 | Non-vape | Disinfectant spray | Lysol Disinfectant Spray | 100 | 0 | 100.00% |
| P15 | Non-vape | Fabric / air refresher | Febreze Fabric Refresher | 100 | 0 | 100.00% |
| P16 | Non-vape | Fabric / air refresher | Febreze Air Effects | 100 | 0 | 100.00% |
| P17 | Non-vape | Surface cleaner | Multi-surface cleaner, trigger spray | 100 | 0 | 100.00% |
| P18 | Non-vape | Surface cleaner | Glass / whiteboard cleaner | 100 | 0 | 100.00% |
| P19 | Non-vape | Surface cleaner | Bleach-based cleaner | 200 | 0 | 100.00% |
| P20 | Non-vape | Thermal styling | Curling iron, dry hair (using a wig) | 200 | 2 | 99.00% |
| P21 | Non-vape | Thermal styling | Hair dryer | 200 | 0 | 100.00% |
| P22 | Non-vape | Water vapor | Shower steam (using clothing steamer) | 100 | 0 | 100.00% |
| P23 | Non-vape | Combustion / fume | Soldering fume (used to simulate welding from shop class) | 300 | 9 | 97.00% |
| P24 | Vape | Nicotine vape | Disposable device | 800 | 9 | 98.88% |
| P25 | Vape | Nicotine vape | Refillable pod device | 200 | 4 | 98.00% |
| P26 | Vape | Nicotine vape | High-VG e-liquid | 400 | 1 | 99.75% |
| P27 | Vape | Nicotine vape | High-PG e-liquid | 400 | 6 | 98.50% |
| P28 | Vape | Nicotine-free vape | Zero-nicotine e-liquid | 200 | 3 | 98.50% |
| P29 | Vape | THC vape | Delta-8 cartridge device | 500 | 9 | 98.20% |
| P30 | Vape | Filtered vape | Vape exhaled into clothing | 400 | 7 | 98.25% |
Results by test distance
| Source type | Distance | Events | Correct | Errors | Accuracy |
|---|---|---|---|---|---|
| Non-vape | 0–1 ft | 1,271 | 1,262 | 9 | 99.29% |
| Non-vape | 1–2 ft | 869 | 861 | 8 | 99.08% |
| Non-vape | 2–3 ft | 874 | 864 | 10 | 98.86% |
| Non-vape | 3–4 ft | 850 | 840 | 10 | 98.82% |
| Non-vape | 4–5 ft | 809 | 805 | 4 | 99.51% |
| Non-vape | 5–6 ft | 827 | 822 | 5 | 99.40% |
| Vape | 0–1 ft | 662 | 654 | 8 | 98.79% |
| Vape | 1–2 ft | 443 | 431 | 12 | 97.29% |
| Vape | 2–3 ft | 461 | 456 | 5 | 98.92% |
| Vape | 3–4 ft | 462 | 455 | 7 | 98.48% |
| Vape | 4–5 ft | 433 | 429 | 4 | 99.08% |
| Vape | 5–6 ft | 439 | 436 | 3 | 99.32% |
Results by measurement type
| Source type | Measurement | Events | Correct | Errors | Accuracy |
|---|---|---|---|---|---|
| Non-vape | seconds | 800 | 789 | 11 | 98.62% |
| Non-vape | sprays | 4,200 | 4,165 | 35 | 99.17% |
| Non-vape | squirts | 500 | 500 | 0 | 100.00% |
| Vape | puffs | 2,900 | 2,861 | 39 | 98.66% |
Error analysis
The dataset contains 46 false positives and 39 false negatives, totaling 85 classification errors.
False positives were recorded for aerosol antiperspirants (20), combustion/soldering fume (9), aerosol body sprays (9), dry shampoo (4), thermal styling (2), and hairspray (2). The other non-vape categories recorded no false positives in this study.
False negatives totaled 20 nicotine-vape events, 9 THC/Delta-8 events, 7 filtered or exhalation-into-clothing events, and 3 nicotine-free vape events.
What the results mean in practice
What does 98.9% accuracy mean?
The 98.9% figure describes performance in this dataset. Results can vary with airflow, room layout, installation, source characteristics, and distance. Individual products and test conditions can perform above or below the aggregate result.
How should a positive alert be interpreted?
The observed false-positive rate was 0.836%: 46 of 5,500 non-vape trials produced an alert. This is the proportion of non-vape trials incorrectly classified as vaping, not the proportion of all alerts that were false.
In this corpus, 2,861 of 2,907 positive classifications were true positives, giving 98.418% precision. The remaining 46 positive classifications, or 1.582%, were false positives. Genuine vape events represented 34.52% of the corpus. Field precision depends on how often vaping actually occurs and on the background sources and operating conditions; the study’s precision should not be assumed to apply unchanged in deployed schools.
Response time, aerosol travel, and an empty room on arrival
Alert timing includes both the time aerosol takes to reach the intake and the device’s processing time once enough aerosol is present. Distance, plume size, exhalation direction, and airflow affect the first component. A small puff directed downward or into clothing may take longer to reach the device or may never reach a detectable concentration.
A person can leave before aerosol reaches the sensor or before staff arrive. An empty room on arrival does not by itself establish a false positive. Response protocols, sensor placement, and supported camera or video-management integrations can help teams review the event.
Coverage and deployment guidance
Triton recommends approximately 160 square feet per ULTRA sensor, with ceilings up to 8.5 feet. Internal testing found that multiple-puff events produced sufficient aerosol for detection at each distance tested within that envelope. Larger spaces, higher ceilings, strong exhaust, or small puffs filtered through clothing can lengthen response time or contribute to a missed event.
The 160-square-foot recommendation is installation guidance, not a guarantee of uniform 98.9% accuracy. The accuracy dataset covers 0–6 feet and does not establish performance beyond that range. Spaces that exceed recommended coverage should use additional sensors. Triton can review placement, unit count, sensitivity, airflow, and response protocols for individual buildings.
Separate evidence bases: response-time and coverage guidance draws on Triton’s internal timing tests and aggregated customer feedback. It is not part of the 8,400-event accuracy calculation, and customer feedback does not establish a measured field precision.
Study limitations
- Testing distances were limited to 0–6 feet. No measured accuracy rate beyond 6 feet can be inferred from this dataset.
- The non-vape interference set is broad but does not cover every substance or activity that may occur in a deployed environment.
- Room layout, HVAC, airflow, sensor placement, background aerosol, source characteristics, and installation conditions can affect performance.
- The event log does not contain enough information to independently assess alert latency, airflow, temperature, humidity, or placement relative to HVAC equipment.